Introduction to Communication Systems
Objective of a communication system
To send as much data as possible as quickly as possible as reliable as possible and as efficiently as possible.
We have physical restrains:
- Technology
- cost
- nonlinear response
- noise
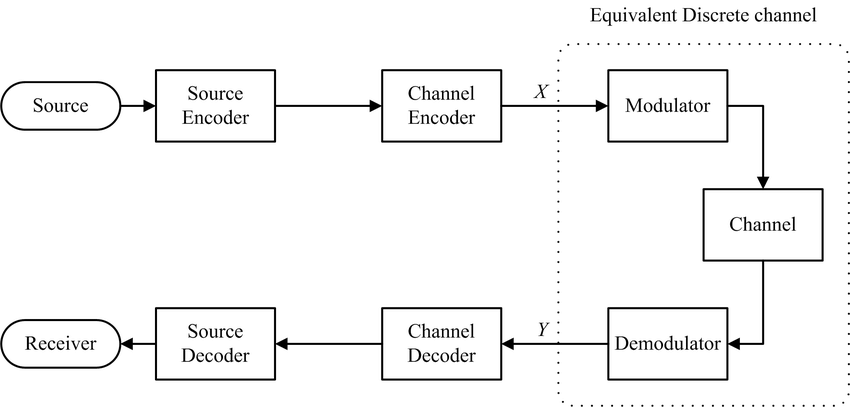
Design Functional System:
Source–>Encoder–>Channel (Noise)–>Decoder–>Destination
Obvious thing to do is use analogue system as message waveforms are analog in nature and waveform sent over the channel must be analog
Non-linear, effectively the distortion that our system imparts on the perfect information that we wish to communicate.
if the distortion is deterministic, we can correct it. In comms, we call this correction digital pre distortion, and it is used aggressively to sort out the imperfections, or nonlinearities in the various parts of your phones for example
Source
- Generates the message to be delivered, (viewed as an abstract signal) a.k.a continuous time signal
Encoder
- coverts message into physical signals suitable for transmission over a channel, includes a multifold of items to be processed as it includes compression, encryption, error-correcting coding and modulation
Channel
- An abstraction of the physical medium that carries the transmitted signal to the destination
- The channel typically attenuates, distorts, and add noise to the transmitted signal
Decoder
- Receives the signal from the channel and reconstructs the original message, it also carries out computing the function of the message
Destination
- typically requests the message from the source
Analogue or Digital
Analogue system take a straightforward approach
-
Directly coverts source waveform to a waveform suitable for transmission over a channel
- Examples include Telegraph/Telephone Systems, Intercoms, Marconi Systems and AM & FM Radios
- Often source information is analogue (Speech,Image and Video)
- Signals sent over physical channels are always analogue
- Current, Voltages, Em Waves are continuous valued, continuous time functions
Technologies have evolved to use digital systems:
- Digital cellular (2G-5G)
- Analogue techniques are unreliable and inefficient
Why Digital?
- Cheaper, reliable and scalable (ideal for volume production)
- Source channel separation (Source Coding)
- Possible to improve transmission efficiency by compression
- Possible to improve reliability and probability of successful transmission
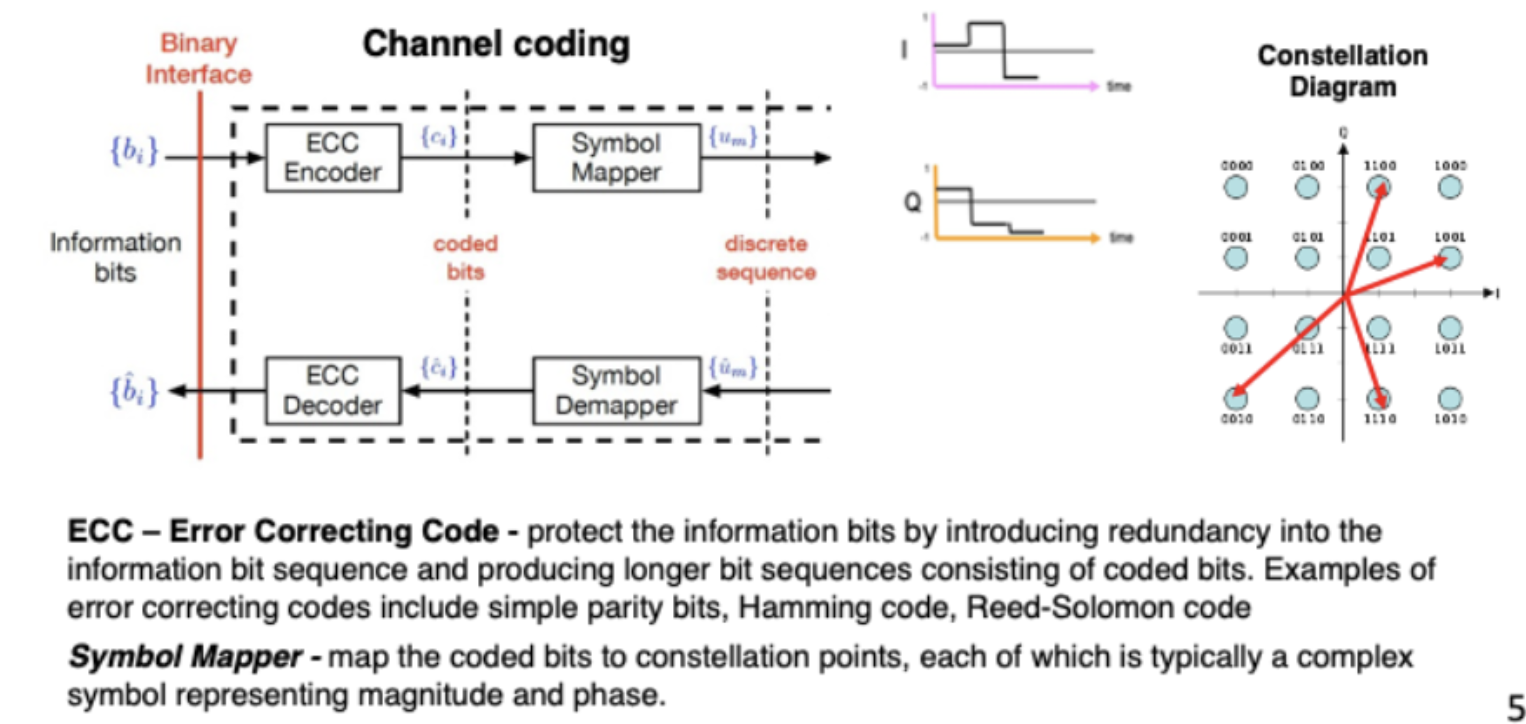
- Using error correction - Parity Bits, Hamming Codes, etc
- Source coding and channel coding can be independently designed
- Not possible in analogue system
Source Coding
Works by taking the signal and boosting the smaller amplitudes and decreasing the accuracy of the larger amplitudes this signal then goes through the channel with an improved signal to noise ratio then the inverse compression is applied by the decoder to get the original signal
Shanon’s Theorem
- Any source can be represented to any number of bits: required rate depends on resolution
- We can communicate those reliable over any channel up to its “capacity”
- $C$ is the channel capacity bit/s
- $B$ is the bandwidth of the channel
- $\frac{S}{N}$ is the signal to noise ratio
- Source Encoder - responsible for taking the source analogue signal and digitalising it and if possible provider compression
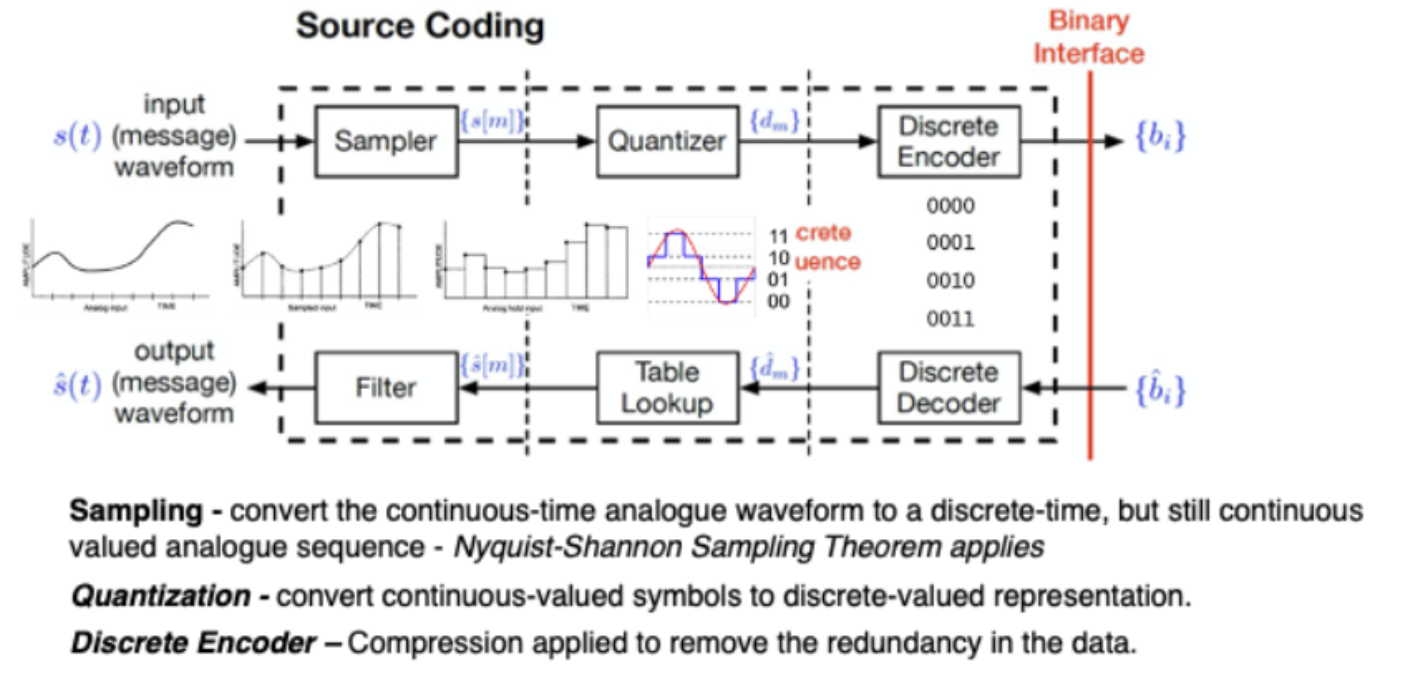
Nyquist Theorem, that states we must sample at at least \(2 \times f\_{max}\) to make sure no information is lost
-
Sampler finds the points need to be given to quantiser.
-
These discrete analogue levels, that are still continuous time waveforms which take on a staircase form, here shown as ${S[m]}$ are then quantised into digital representations of their value, by a quantiser ${d_m}$ . These two process combined covert the analogue signal to a digital signal
-
Now that this information is in digital form, advanced processing can be applied, and here, the discrete encoder will compress the data, remove redundancy (for example quiet periods in a microphone generated signal), and generate binary data ready for transmission ${b_i}$
-
The bottom half of the graphic here shows the reverse process, where the received, demodulated digital information is decoded, un-compressed, and so on, and then used to look-up the corresponding analogue value to reconstruct the discretized, staircase waveform.
The Channel (23/04/24)
- A medium connecting the transmitter and receiver
- Channels come in many forms
- The channel can distort, add noise and have interference that are specific to the medium
- Wire-based channels are generally well behaved, linear time invariant systems (consistent behaviour during signal processing)
- Wireless channels subject to atmospheric effects, mobility and fading due to multipath
- Both are subject to attenuation and interference
- Optical fibres are susceptible to non-linearity
linearity in communications means a simple, proportional, and predictable response to inputs, while nonlinearity involves complex, often unpredictable interactions where the output does not straightforwardly follow the input.
-
There is unavoidable presence of noise in the channel
- noise refers to unwanted interferance that disturbs communications
- signals are contaminated by noise along the transmission path
- External Noise - interferance from nearby channels, artifical noise and naturally occurring noise
- Internal Noise - Thermal noise,shot noise (in all electronic devices)
\[\frac{S}{N}=\frac{P_S}{P_N}\] \[\frac{S}{N}(dB)=10\log\frac{P_S}{P_N}\]Due to Shannon’s Theorem noise is one the fundemental factors affecting the capacity of the channel as shown by SNR
$P_S = \texttt{singal power (watts)}$, $P_N = \texttt{noise power (watts)}$
- it is possible to reduce noise through clever design of transistors and amplifer’s for eg
As we are finidng SNR we use $10\log$ but if we were finding voltage ratios we would use $20\log$
- One instrument we can use for measuring the signal to noise ration is a spectrumanalyser
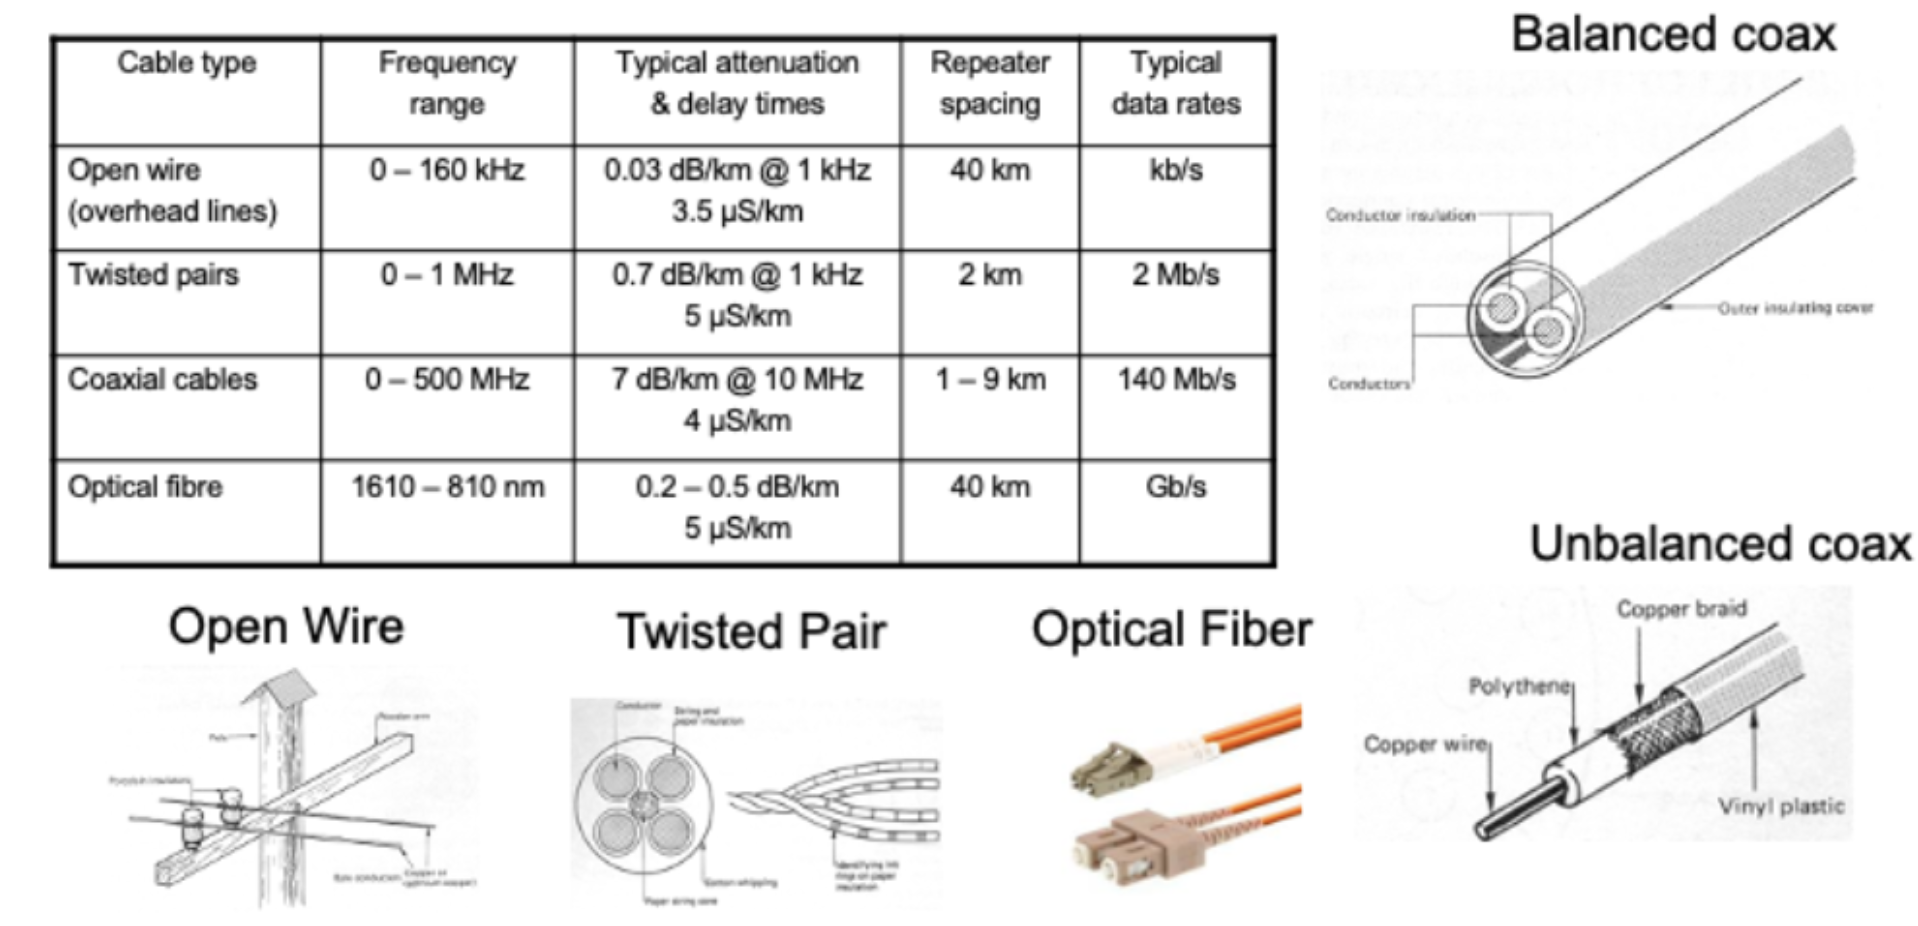
Bandwith of Common Materials
- Simpler copper wire: 160 kHz
- Twisted pair: 1 MHz (simple transmission line)
- Coaxial cable: 500 MHz (for significant distance)
- Optical cable: THz (as uses light channel thus highest capacity we consider)
Wired Circuits
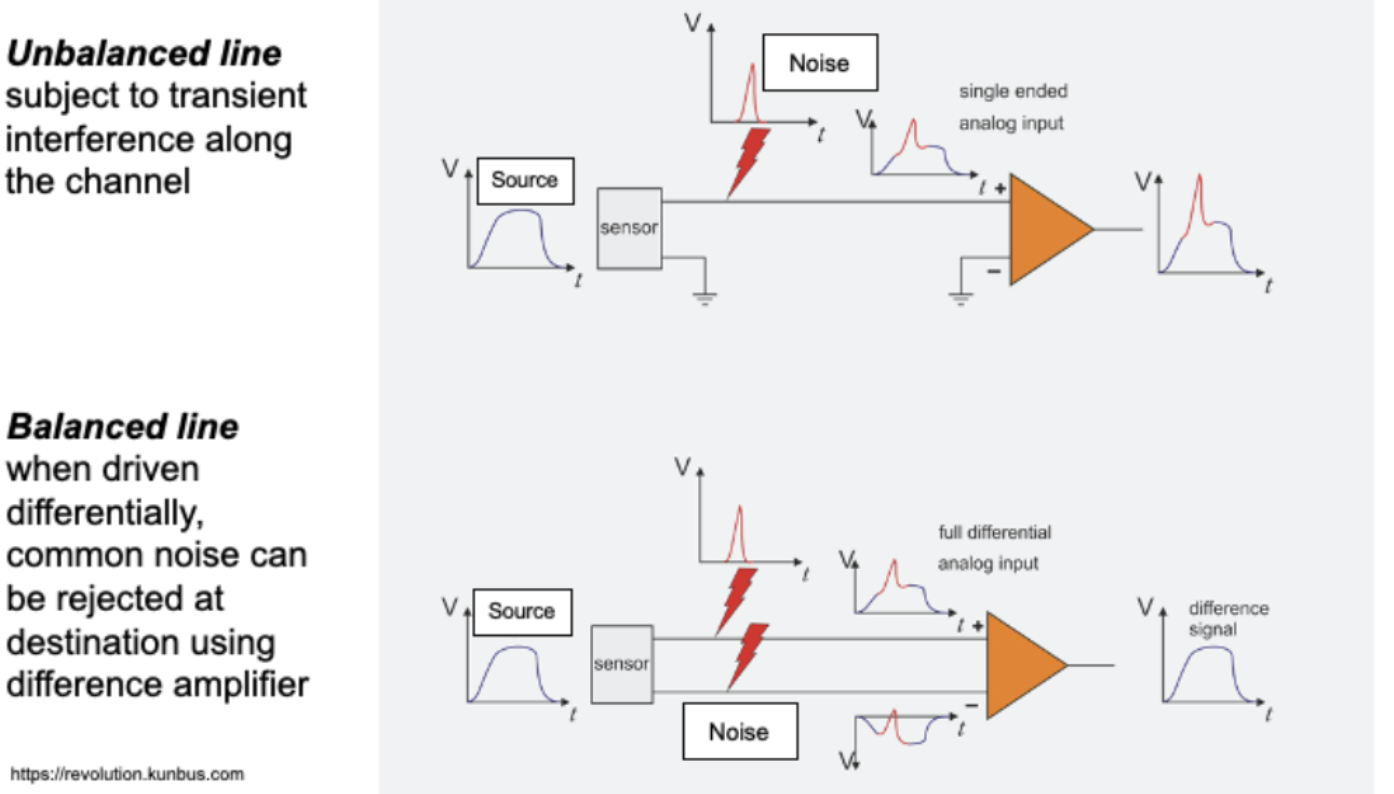
- Unbalanced Line - An unbalanced line uses a single conductor paired with a ground shield, which can lead to increased noise and interference due to the unequal impedance between the signal path and the return path.
- Balanced Line - A balanced line uses two conductors carrying the same signal in opposite phases, which effectively cancels out interference and maintains signal integrity, thanks to matched impedance across both conductors.
| :Pros & Cons of Wired Circuits: | |
| :Pros: | :Cons: |
| Path loss is usally small compared to other sources | Though cables are cheap laying them is expesnive |
| Signal Energy is confined, so cross line interferance is small | Permission is required for passage along land and property |
| Channel attenuation and distortion is usally small, stable and easily corrected | Brodcasting requires a connection to each user |
| Capacity is unlimited, can lay multiple lines at the same time | Networks are esentially so reconfiguration is not easy |
| – | Copper is becoming expensive |
-
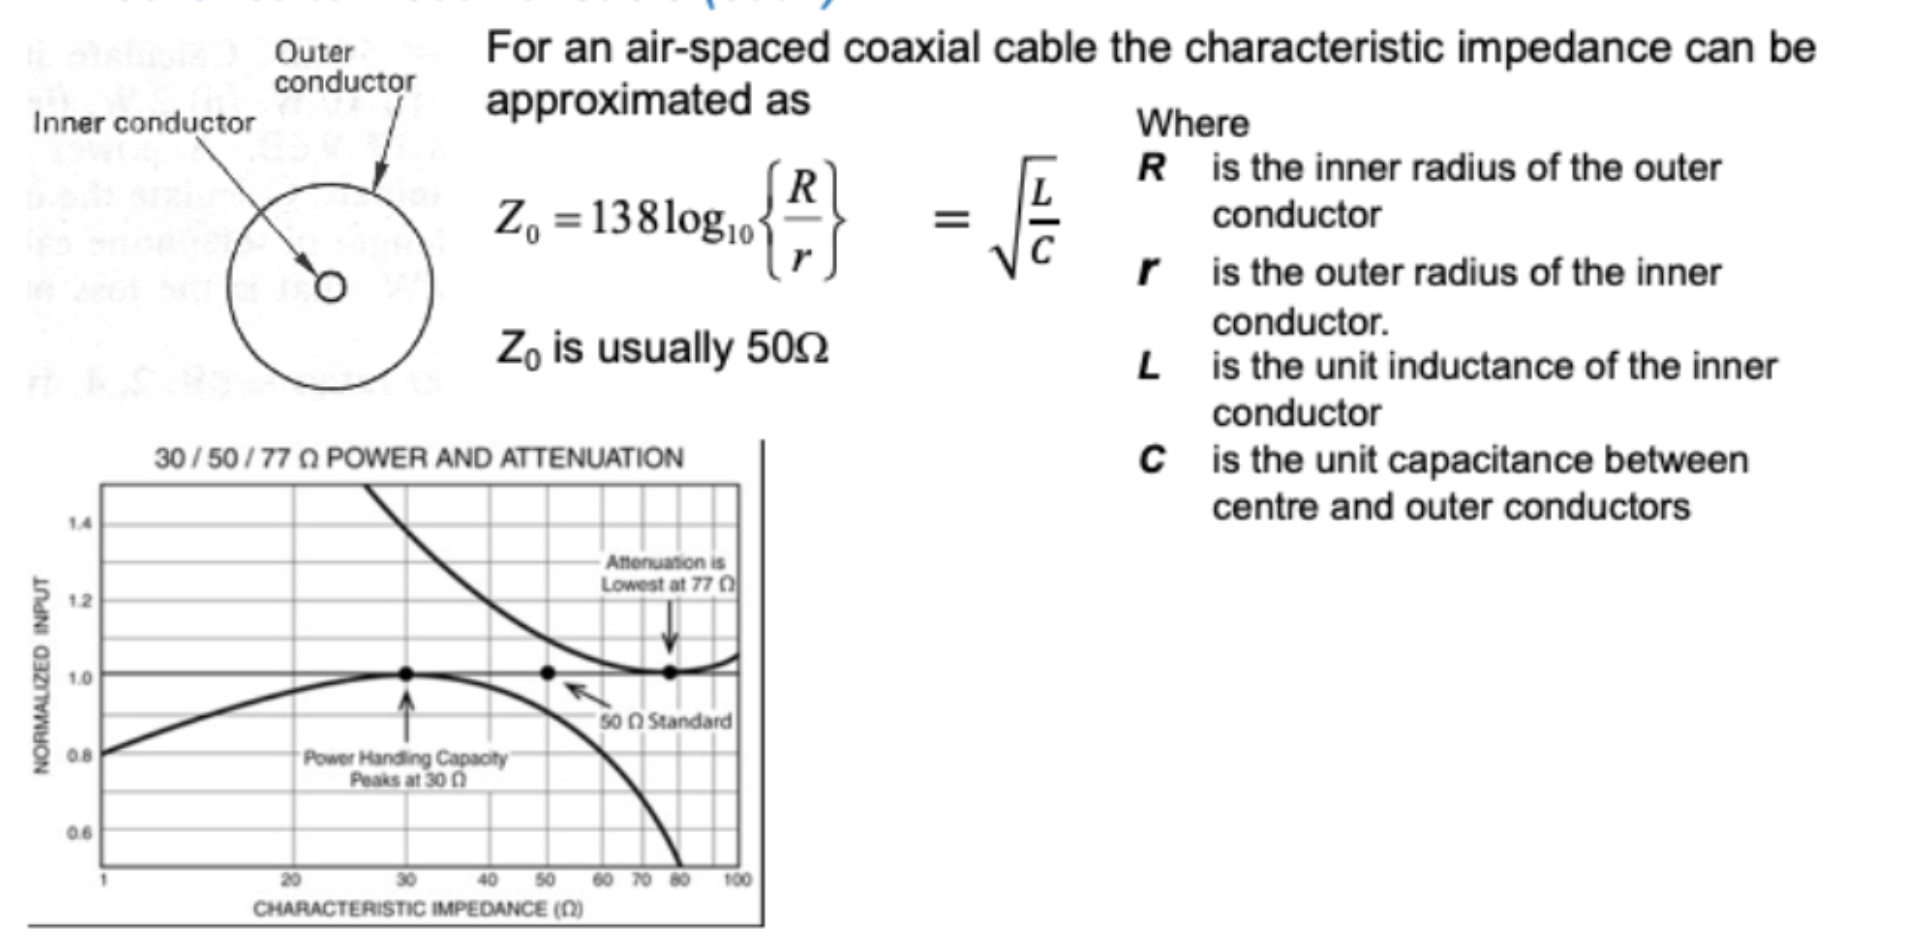
Characteristic impedance is a fundamental property of transmission lines, like coaxial cables, that describes the impedance an electrical signal encounters as it travels along the cable. It is crucial for ensuring that the signal is transmitted efficiently without reflections, which can degrade the quality of the signal.
-
The characteristic impedance of coaxial cables can often be approximated using the physical dimensions of the cable, particularly the radii of the inner conductor and the outer conductor. The formula involving these dimensions (inner radius $r$ and outer radius $R$) helps calculate the impedance based on how the electromagnetic fields interact within these geometrical constraints.
-
Another way to understand characteristic impedance is by considering it as the square root of the ratio of the inductance per unit length ($L$) to the capacitance per unit length ($C$) of the cable. This relationship is derived from how the electric and magnetic fields are stored and propagated along the cable, respectively. For a hypothetical small segment of the cable (say, $1 mm$), this ratio provides a clear picture of the cable’s impedance characteristics.
-
To minimize signal reflections and potential signal loss or distortion, it’s essential that all components in a transmission system (such as connectors, cables, and devices) are matched to the same impedance, typically 50 Ohms in many applications, including RF communications and data transmission. This matching is critical in applications where signal integrity is paramount.
Its important to remember that all parts of these systems, where signals arepropagating, need to be matched to 50 Ohms to minimise reflections.
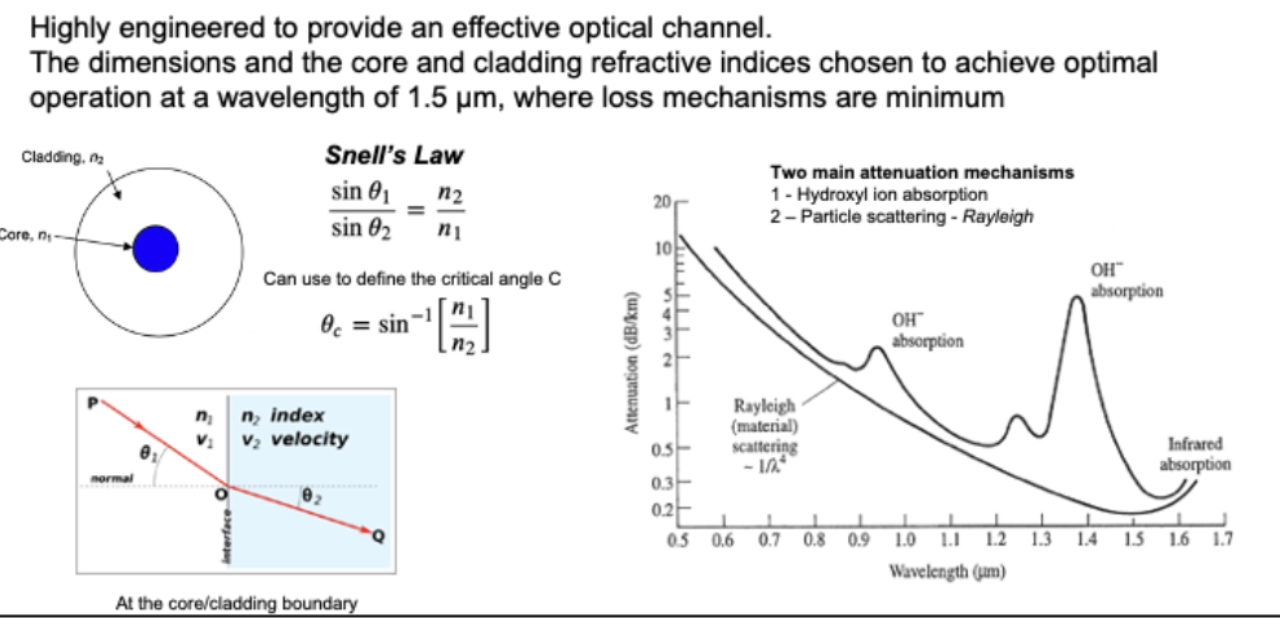
Snell’s Law
\[n_1 \sin\theta_1=n_2 \sin\theta_2\]- $n_1$ and $n_2$ are refractive index’s
- $\theta_{1}$ is angle of incidence
- $\theta_{2}$ is angle of refraction
Critical Angle
\[\theta_{c}=\sin^{-1}[\frac{n_1}{n_2}]\]Application in Fiber Optic Cables
Fiber optic cables are designed to carry light signals over long distances with minimal loss by trapping light within the core of the fiber through total internal reflection.
- Fiber optic cables consist of a core and a cladding, each made from materials with different refractive indices. The core has a higher refractive index than the cladding.
- When light traveling through the core hits the core-cladding boundary at a high enough angle (greater than the critical angle), Snell’s Law predicts that the refractive index change would cause the light to bend back into the core rather than passing into the cladding.
- The critical angle is determined using Snell’s Law. If the angle of incidence $\theta_{1}$ within the core is greater than this critical angle, then $\theta_{2}$ becomes greater than $90$ degrees, which means the light does not exit into the cladding but is instead totally internally reflected. This keeps the light confined within the core, allowing it to travel long distances through the cable.
- By maximizing the incidence of total internal reflection, fiber optic cables minimize loss and maintain the integrity of the light signal as it travels. This is essential for telecommunications, where preserving the strength and quality of the signal is crucial.
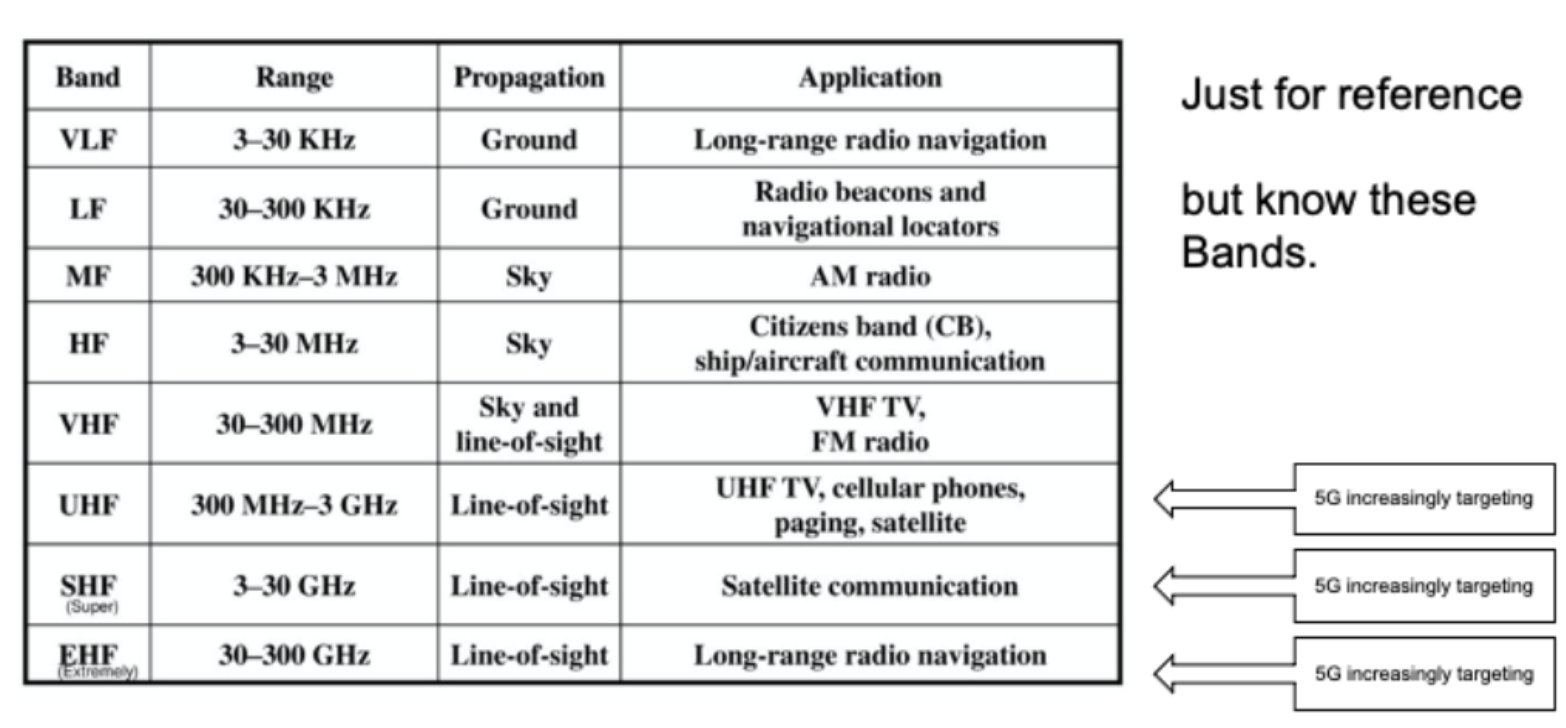
Wirless Circuits
- The concept of wireless transmiion is the transmission of through free space using the propogating effects of electromagnetic waves
- How far we can actually transmit the data depends upon the frequency used and the nature/characteristics channel
Modes of Transposrt in wireless communications
- Ground/Surface waves - propagate at the interface of a medium :- eg ocean waves
- VLF em waves travel in contact with earth’s surface and use the area between the surface of the earth and ionosphere for transmission
- one of the issue with these type of waves is that they are suspectiable to reflection,refraction and scattering by objects on the ground, such as terrain (mountain,built enviorment) but they can travel large distances especially at lower frequencies.
- an advantage on the other hand is that there is no need for the transmitter and receiver to be able to see each other, as the waves simply follow the curvature of the earth between the ground and the ionosphere
the ionosphere is the region above the troposphere from about 50 to 250 milesabove the earth
-
The suns ray cause the ions to form in this region, and due to slowly recombining, so we find different transmission between night and day
-
Sky waves - higher in frequency and are refracted back to earth by ionospheric layer of theearth’s atmosphere
- By repeated reflection, from the ground back to the ionosphere, communication can beestablished over 1000s of miles, mainly at frequencies below 30MHz
-
Space waves - radio waves that occur within the 20km of theatmosphere, in other words, the troposphere, comprising of a direct and reflected waves.
- This is also known as a line-of-sight propagation as the signals are sent in a straight line from thetransmitter to the receiver. Mobile phone transmission uses space wave propagation, as doessatellite transmission uses space wave propagation, but without any reflection involved
| :Pros & Cons of Wireless Circuits: | |
| :Pros: | :Cons: |
| Fairly cheap to implement | Path loss is large (as compared to wired commuincation) |
| Permission only needed for transmiiter tower | Permission only needed for transmiiter tower |
| Inherent brodcasting ability (compatability) | capacity is fixed by design (2G - 5G) |
| Networks are easily reconfigarable | Frquency coordiantion is required (not easy & expensive) |
Phase Velocity
Any signal takes a finite time to traverse a channel, the phase velocity is descirbed as the velocity at which a sinusoidal waves propgates through the channel
\[v_p=\lambda f\]Where
- $v_p$ = the phase velocity (m/s)
- $\lambda$ is the wavelength (m)
All electromagnetic waves travel at speed of light
- $f$ is the frequency (Hz)
When in free space the phase velocity is of light thus $v_p = 3.8 \times 10^8$ hence othersie the phase velocity depends on the medium
In one $\lambda$ one a phase change of $2\pi$ rad occurs, hence the phase change per metre is $\frac{2\pi}{\lambda}$ rad a.k.a phase change coefficent
\[\beta = \frac{2\pi}{\lambda}\]Therefore we can rearrange the equation for phase velocity
\[v_p=\frac{2\pi}{\beta}\cdot f\] \[v_p=\frac{\omega}{\beta}\]second equation is derived from the fact that angular frequency is $\omega = 2\pi f$

- Dispersion Basics:
- Occurs when different frequencies of a signal travel at different speeds within a medium.
- Results in phase velocity (VpVp) and group velocity (VgVg) differing, affecting wave propagation.
- Signal Integrity Issues:
- Temporal dispersion leads to signal distortion over distance, complicating the reception and interpretation of the data.
- Particularly affects amplitude-modulated signals with multiple frequency components (carrier and sidebands).
Analyzing and Mitigating Dispersion
- Non-linear $\beta$ vs. Frequency Relationship:
- Indicates that the medium is dispersive, impacting how different frequencies travel.
- Essential for predicting how amplitude modulated signals are affected, with each frequency component potentially having a different group velocity.